Scriptly ayuda a las farmacias a identificar tendencias en tiempo real con Reveal
En general, un gráfico es una representación visual de datos. Los gráficos permiten a las empresas ver los resultados de sus acciones y estrategias para comprender mejor lo que funciona y lo que no, a fin de predecir con eficacia eventos futuros y planificar en consecuencia.
Dicho esto, un gráfico incrustado es un gráfico que se ha incrustado directamente en el contexto del flujo de trabajo del usuario, normalmente como parte de un paquete de software analítico o de análisis integrado.
Una vez más, los gráficos, incrustados o no, muestran datos comerciales y KPI para ayudar a los usuarios y a los responsables de la toma de decisiones a obtener una mejor imagen y guiar una toma de decisiones más inteligente. Aquí hay algunas formas particulares en las que los gráficos integrados son extremadamente útiles:
Estos son solo algunos ejemplos de para qué se pueden usar los gráficos integrados, pero hay muchos más casos de uso para ellos según la industria y el negocio en sí, así como las preguntas comerciales que los usuarios desean responder.
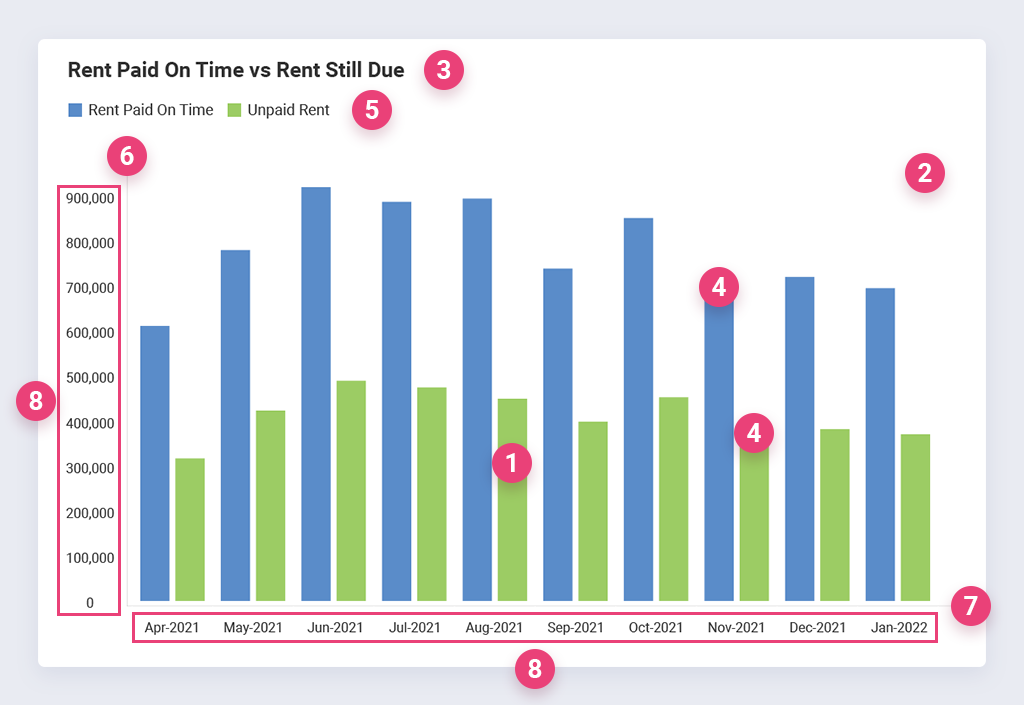
Un solo gráfico incluye muchos elementos: algunos de estos elementos se muestran de forma predeterminada, mientras que otros se pueden agregar sobre la marcha y solo si es necesario. Una buena solución de análisis permitirá a los usuarios personalizar gráficos, cambiar elementos de gráficos, moverlos, cambiarles el tamaño o eliminar elementos de gráficos que los usuarios no desean mostrar.
Estos son los elementos clave incluidos en un gráfico incrustado:
Por supuesto, se podrían incluir otros elementos en un gráfico incrustado, pero estos son algunos de los más comunes.

Hay infinitos tipos de gráficos para elegir, y cada uno tiene atributos únicos que pueden ayudarlo a transmitir mejor su mensaje o historia de datos dependiendo de múltiples factores. Por ejemplo, un gráfico de líneas puede contar la historia general de las tendencias de datos a lo largo del tiempo más rápido que una narración o números, y un gráfico de barras puede permitirle al espectador comparar rápidamente los recuentos o el rendimiento entre diferentes categorías.
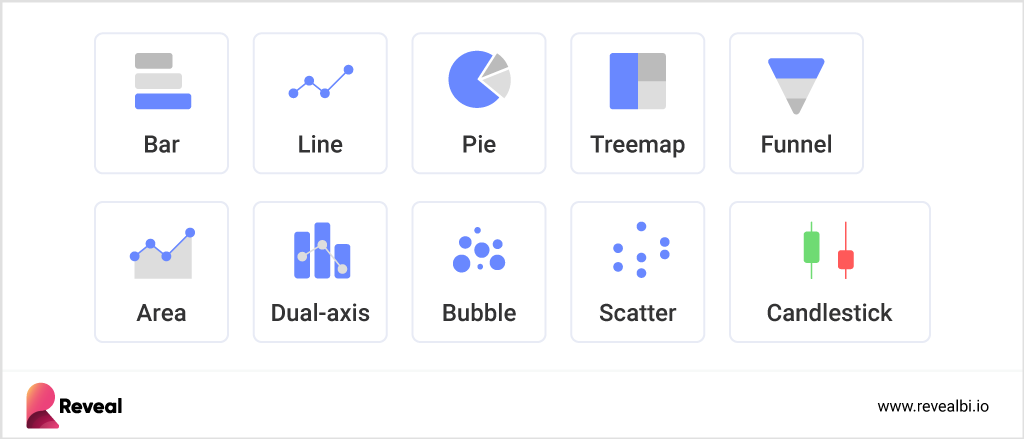
Sin embargo, estos son los tipos de gráficos incrustados esenciales que verá que ofrecen con mayor frecuencia las herramientas de visualización y análisis:
El gráfico de barras, o a veces utilizado como gráfico de columnas, proporciona una forma de mostrar valores de datos representados como barras verticales con alturas y longitudes proporcionales a los valores que representan. Algunos gráficos de barras presentan barras agrupadas en grupos de más de una, mostrando los valores de más de una variable medida. Las barras se pueden trazar vertical u horizontalmente.
Gráfico de líneas: muestra información como una serie de puntos de datos llamados "marcadores" conectados por segmentos de línea recta. A menudo se usa para mostrar datos de tendencias o la comparación de dos conjuntos de datos.
Diagrama de Gantt: proporciona una visualización rápida de proyectos o procesos a lo largo del tiempo. Los diagramas de Gantt incorporados son una excelente manera de descubrir dónde un proceso puede encontrarse o superponerse con otro y hacer predicciones sobre (o ver cuándo) los procesos se están retrasando.
Gráfico circular: este tipo de gráfico incrustado proporciona una forma rápida de ilustrar qué factores están en juego en un determinado proceso. Varias versiones de gráficos circulares son buenas si necesita ver si cada parte del todo está haciendo su parte o si desea ver qué factores son más importantes en un proceso o resultado.
Gráfico de mapa de árbol: muestra datos jerárquicos utilizando nodos anidados (rectángulos) de diferentes tamaños y colores, lo que facilita la detección de patrones de datos o la comparación de cantidades de datos. El tipo de gráfico de mapa de árbol no resuelve el mismo problema que un tipo de gráfico como un gráfico de barras o un gráfico de líneas, sino que está diseñado para una visualización de datos más rica y compleja.

Gráfico de control: estos son tipos específicos de gráficos de líneas o puntos que rastrean los cambios en un proceso a lo largo del tiempo. Estas herramientas de control de procesos estadísticos pueden proporcionar información rápidamente sobre si un proceso está "bajo control" o no. Los gráficos de control a menudo son parte de los tableros de análisis porque se pueden usar para determinar si un proceso está funcionando según lo diseñado o si se puede requerir alguna intervención manual para realizar una mejora o corregir un problema.
Gráfico de área: tiene la misma base que el tipo de gráfico de líneas, pero también agrega un concepto del tipo de gráfico de barras con sombreado entre la línea y una línea de base. El gráfico de áreas incrustado se usa a menudo para mostrar cómo ha cambiado un total a lo largo del tiempo y cómo han cambiado las contribuciones de sus componentes.
Gráfico de doble eje: superpone dos gráficos diferentes con un eje horizontal compartido, pero escalas de eje vertical potencialmente diferentes. A menudo se usa para comparar directamente los dos conjuntos de valores verticales, al mismo tiempo que incluye el contexto de la variable del eje horizontal.
Gráfico de burbujas: un cruce entre un gráfico de dispersión y un gráfico de área proporcional, el tipo de gráfico de burbujas incrustado muestra tres dimensiones de datos o, en otras palabras, muestra la relación entre tres variables. Demasiadas burbujas pueden dificultar la lectura del gráfico, por lo que tiene una capacidad de tamaño de datos limitada. Esto se puede remediar de alguna manera mediante la interactividad: hacer clic o pasar el mouse sobre las burbujas para mostrar información oculta y tener una opción para reorganizar o filtrar categorías agrupadas.
Gráfico de embudo: demuestra el flujo de usuarios a través de un embudo comercial o de ventas: cuántos usuarios llegan a cada etapa del proceso rastreado desde el ancho del embudo en cada división de etapa.
Gráficos de dispersión y de puntos: ambos tipos de gráficos incrustados utilizan puntos para proporcionar una indicación visual de cada punto de datos que se está considerando. Permiten a los espectadores detectar posibles tendencias, valores atípicos y agrupaciones. Por ejemplo, si realiza un seguimiento de la eficiencia de los empleados por día, cada empleado puede estar representado por puntos de diferentes colores. Eso hace que sea fácil ver si un empleado se está desempeñando significativamente por encima o por debajo del resto. Los gráficos también le permiten ver si algún otro elemento, como el día de la semana, afecta el rendimiento general.
Diagramas de caja y bigotes: son útiles para responder preguntas como "¿Son estos dos procesos estadísticamente iguales?" al permitir que los espectadores vean rápidamente si hay valores atípicos que arrastran un proceso hacia arriba o hacia abajo. También son valiosos cuando se comparan promedios, desviaciones estándar y medias de un proceso.
Histogramas: los histogramas son herramientas estadísticas que ayudan a sacar conclusiones de probabilidad al mostrar la distribución de sus datos.
Teóricamente, sus datos podrían funcionar potencialmente con múltiples tipos de gráficos. Sin embargo, depende de usted, como diseñador del tablero, asegurarse de seleccionar el tipo de gráfico que hace que los datos sean claros y concisos para su audiencia: las personas que los verán.
Al elegir un tipo de gráfico, piense en estas preguntas clave:
Elija el punto que desea hacer y seleccione un tipo de gráfico que sea óptimo.
En primer lugar, recomendamos optar por una solución de análisis integrado de paquete completo, en lugar de una solución de gráficos integrados independiente. Cada software de análisis incorporado ofrece una variedad de tipos de gráficos para que los usuarios elijan para visualizar sus datos. Pero también va mucho más allá de las herramientas de visualización de datos. Una buena solución de análisis integrado proporciona a los usuarios capacidades de autoservicio y de marca blanca, y un conjunto de funciones de análisis predictivo y avanzado, como pronósticos, aprendizaje automático y más.
Por supuesto, cada solución en el mercado varía en cuanto a sus características y funcionalidades, sus requisitos de integración y conectividad y, por supuesto, el precio. Entonces, dependiendo de las necesidades de su negocio, estas son algunas de las cosas clave que debe buscar al elegir una herramienta para sus propósitos de análisis de datos.
Si no puede conectar todos sus datos a la herramienta, ¿cómo los visualizará? Asegúrese de que la herramienta de análisis en la que elija invertir ofrezca una amplia gama de fuentes de datos para conectarse a sus datos, de modo que sus usuarios puedan crear tableros de alto impacto en tiempo real de manera fácil y rápida.
Hoy en día, tener información comercial importante al alcance de la mano es una necesidad. Con esto en mente, no olvide buscar capacidades de BI móvil que permitan a los usuarios aprovechar el poder del análisis y la visualización de datos sobre la marcha. De esa manera, los usuarios pueden acceder a información comercial valiosa en sus teléfonos inteligentes en cualquier momento y actuar en el momento del impacto.