Scriptly Helps Pharmacies Identify Trends in Real Time with Reveal

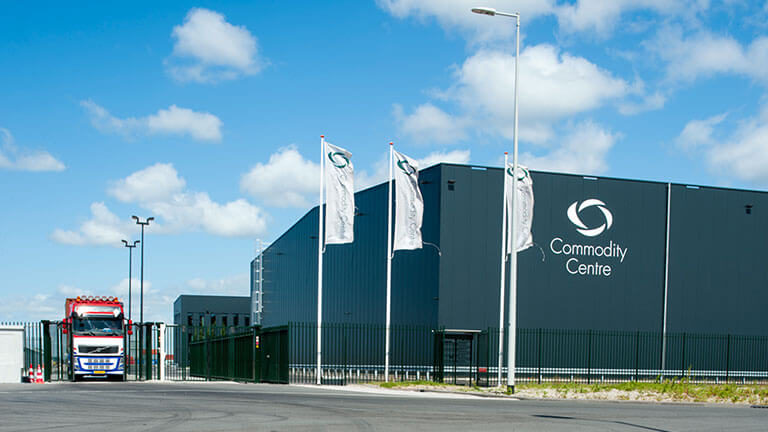
Commodity Centre Group is a leading warehousing and logistics specialist based in the UK and Europe, where they manage and store goods for a variety of industries, including coffee, cocoa, sugar, tea, nuts, general cargo, and metals. Commodity Centre handles the entire supply chain, from origin, shipping and container haulage to customs procedures, warehousing and onward distribution.
Over 550,000 tons of material and precious commodities are safely stored in their state-of-the-art temperature controlled, organic environments. Safeguarding and keeping goods at the optimal temperature, minimizing spoilage and preserving quality with their advanced monitoring system, Commodity Centre ensures constant temperature and regulation, which is especially important to minimize spoilage and preserve quality. Their clients include JDE UK & Ireland, the world’s leading pure-play coffee and tea company, Community Foods, a natural and organic dried food importer/distributor and producer, Olam International, a leading supplier of food ingredients, feed and fiber to thousands of customers worldwide, and Costa Coffee, crafting and serving coffee in 41 countries around the world.
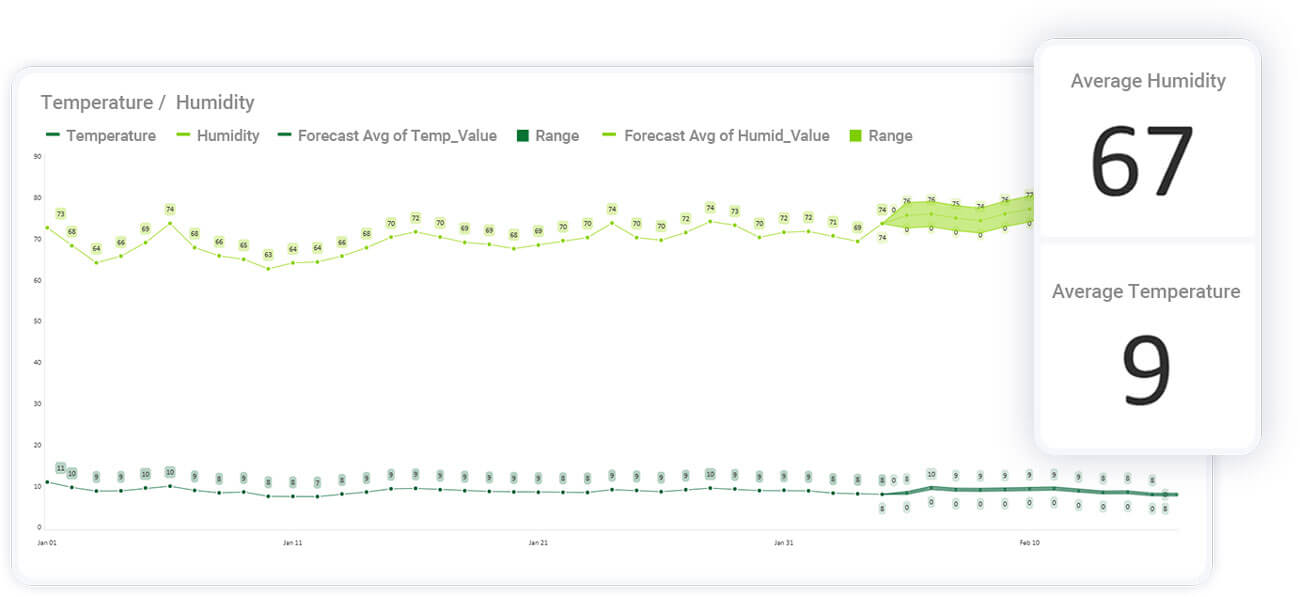
 Warehouse temperature & humidity management dashboard.
Commodity Centre needed an advanced data visualization solution to enhance their own internal business intelligence and to provide clients with a portal into their warehousing data. They wanted to offer their clients a tool that provided them with more information about their product than they have in their own systems. Initially, they relied on Microsoft’s Power BI software, then decided to see what other embedded business intelligence programs were available. Commodity Centre sought a solution that would offer seamless integration, deeper customization, greater ease of use, and an intuitive user experience for their internal teams and their clients.
After researching various business intelligence tools, Peter Ferdowsian, IT Manager at Commodity Centre, chose Reveal for their embedded analytics solution. What attracted him to Reveal was its flexibility, ease of integration, responsive development support team and fixed pricing. Unlike Power BI, Reveal offered predictable pricing and simplified integration, reducing operational headaches and uncertainty about costs.
Ferdowsian explained, “It blew my mind—the stuff you could do with Reveal and how easy it was to work with. Even people with no skills are able to drag and drop elements in a way that makes sense to them. Behind the scenes, Reveal feels like it’s organically a part of our software – not something that’s just been dropped on the page.”
Reveal enabled Commodity Centre to create a highly customizable portal where users could log in and view detailed data about stored commodities in real time. The system supports dashboards tailored to specific needs, like stock levels, available warehouse space, temperature, humidity conditions, and container tracking.
With Reveal, Commodity Centre was able to enhance the experience for internal teams by delivering more intuitive, interactive, and insightful data visualizations.
“Reveal provided the flexibility to tailor dashboards and reports to specific needs, leading to improved decision-making, increased operational efficiency, and a better overall user experience”
Peter Ferdowsian, IT Manager at Commodity Centre
Another reason Peter chose Reveal is because he knows that he can easily reach Reveal’s development team. “It is amazing that we have a direct link to the people making the software, which is not something you really get with other companies.”
Reveal adds features so quickly that every time Commodity Centre tries to do something new, the feature is at their fingertips. “We’ve not actually asked for any new features or even suggested anything, because every time we go in and try and do something different, that feature is already there anyway,” Peter explained.
The Reveal implementation process was smooth and quick. According to Ferdowsian, “It took just a couple of months to fully implement and integrate Reveal into our system.” This was significantly faster than trying to build and maintain their own platform in-house.
One key to Commodity Centre’s success with Reveal is its ability to offer tailored visualizations that fit seamlessly into Commodity Centre’s existing software. Ferdowsian notes, “Our development team could customize dashboards that look and feel like part of our application, not something that’s just been dropped in.”
One key benefit to Reveal is the ability to show spare capacity within its 3,500,000 sq. ft. of dedicated storage space. When a large shipment is due, they can easily see where and how they can free up space to accommodate the delivery. A product like nuts needs to be segregated far away from other food products and Reveal shows them capacity, product segregation, climate and urgency, which are critical tools in agile decision making.
“A lot of our warehouse information is available as data and numbers, but spreadsheets don’t really resonate with people,” Peter said. “When they can visualize the data, it provides a greater understanding of the intricacies such as climate, available space and products in each warehouse. Our team uses Reveal visualizations to understand the urgency of each delivery and what we need to do for every client.”
Reveal has transformed the way Commodity Centre manages and visualizes their data. As a result, internal warehouse efficiency has improved and they are giving their clients more valuable insights into their stored goods than they’ve ever had before. By empowering their team with real-time insights and data-driven decision-making, Reveal has equipped Commodity Centre with the tools they need to deliver sustainable, innovative and cost-efficient solutions.
Commodity Centre is set to expand its use of Reveal, including the introduction of container tracking and enhanced environmental condition monitoring in the near future.

BOOK A PERSONALIZED DEMOBook a Personalized DemoWatch a DemoFREE TRIAL
Back to Top