Optimize Your Energy Analytics & Reporting
Address challenges, mitigate risks, and capitalize on emerging opportunities with an industry-leading embedded analytics solution. Energy analytics help you gain a single source of truth and improve your organization’s decision-making process, making decisions around consumption, distribution, and resource utilization more informed, effective, and, most of all, data-driven.
Watch a Demo BOOK A PERSONALIZED DEMO Request a Demo FREE TRIAL
The Importance of Embedded Analytics in the Energy Sector
By embedding analytics into your energy operations, you can optimize processes, improve efficiency, and drive cost savings. Energy analytics insights help you identify operational bottlenecks, streamline workflows, and identify areas for improvement through data-driven analysis. Whether optimizing maintenance schedules, improving asset utilization, or reducing downtime, energy analytics equips you with the insights needed to achieve operational excellence.Top Benefits of Embedded Analytics for the Energy Sector
Enhanced Operational Efficiency
Embedded analytics enables energy companies to optimize their operational efficiency by providing real-time insights into energy consumption, production, and distribution. It allows stakeholders to monitor and analyze energy data centrally, identify inefficiencies or anomalies, and take proactive measures to improve operational processes.Reduced Energy Costs
With real-time insights into your energy data, you can quickly take action to minimize costs. That can be achieved through optimizing your demand management to minimize peak demand charges and penalties and by identifying areas of inefficiency where you can implement targeted energy and cost-saving measures, for example.Predictive Maintenance
By analyzing data from sensors, smart meters, and IoT devices, you can detect equipment failures or performance degradation in advance. Predictive analytics capabilities in the energy sectors also help identify maintenance needs, schedule proactive maintenance activities, and prevent costly downtime.Regulatory Compliance
Another benefit of energy analytics is that it facilitates the monitoring and reporting of energy-related data required for regulatory compliance. Energy organizations can track greenhouse gas emissions, energy usage, and other sustainability metrics to meet reporting obligations and demonstrate commitment to environmental responsibility.Why Partner with Reveal
Seamless integration
Reveal is designed to seamlessly integrate into your existing infrastructure, saving you valuable time and resources. Reveal’s robust API allows effortless integration with your preferred platforms, applications, and databases.Deploy Anywhere
With Reveal, you are in charge of deployment. Reveal runs on Windows, Linux, or Mac servers, with backend SDKs for .NET, Java, and NodeJS. Deploy on-prem or to any cloud or any container in the cloud.Native SDK
Reveal’s native web, desktop & server SDKs can be integrated into applications on any platform and tech stack, including .NET Core, Java, NodeJS, and front-end technologies such as JavaScript, React, Angular, Web Component, VueJS, jQuery, MVC and Java Frameworks like Spring, Tomcat, Apache.Secure by Default
Data access is controlled by you. You have complete control over queries, parameters, and filters sent to your data sources. We have added capabilities to support multi-tenant backends and row-level filtering for per-user security.Self-Service
Enable everyone on your team, in every department, to create custom and insightful dashboards and reports independently. When everyone has access to and can easily understand data, the decision-making process becomes better, wiser, and, most importantly, data-driven.Fully Customizable
Reveal gives you 100% control over your app UX and greatly improves your customer’s experience. With white labeling, you can fully customize the fonts, colors, button shapes, and more of Reveal so your dashboards and reports perfectly match your brand’s unique theme.Experience the Benefits of Energy Analytics Today
What Our Customers Have to Say
Jim Richardson President of Atanasoft
John Gomez CEO of Sensato
Ninad Amondikar Data Product Manager at Casebook
Energy Analytics Dashboard Examples
Energy Consumption
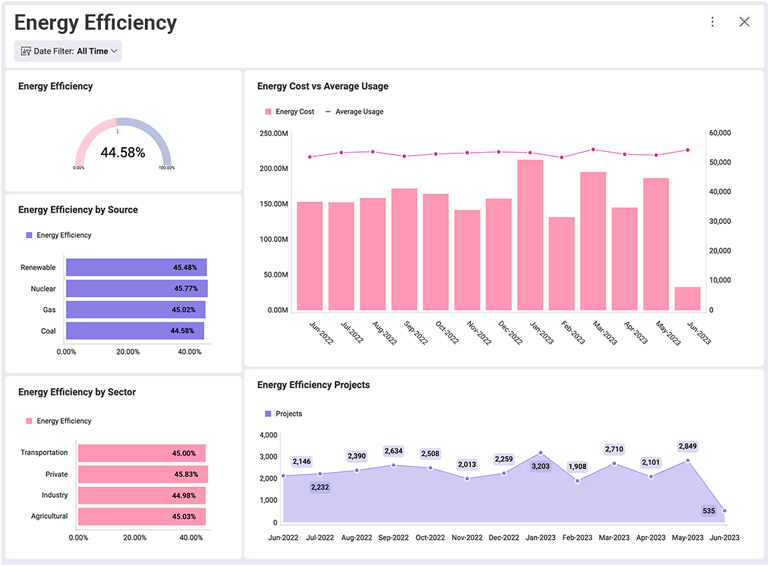
An energy consumption dashboard visually represents key metrics such as total energy consumption, peak demand, average usage, and energy costs. It also sometimes includes current energy usage, energy consumption patterns over time, budget tracking and cost analysis features, carbon emissions and energy intensity, and comparative analysis – users can compare energy consumption across different buildings, departments, or units within an organization.
Renewable Energy
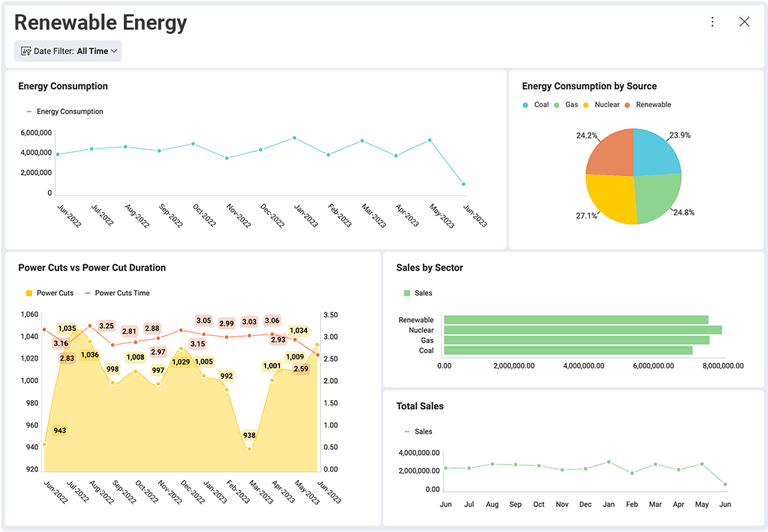
The renewable energy dashboard provides an overview of renewable energy sources, their production levels, and the associated environmental benefits. Among others, it may also include environmental impact metrics such as carbon emissions reduction or avoided emissions, KPIs like capacity factor and energy yield, and information on energy storage, mix, and contribution. Weather conditions data such as solar irradiance, wind speed, and precipitation, as well as geographical maps showcasing the locations of the energy installations, are also often visualized.
Energy Financial
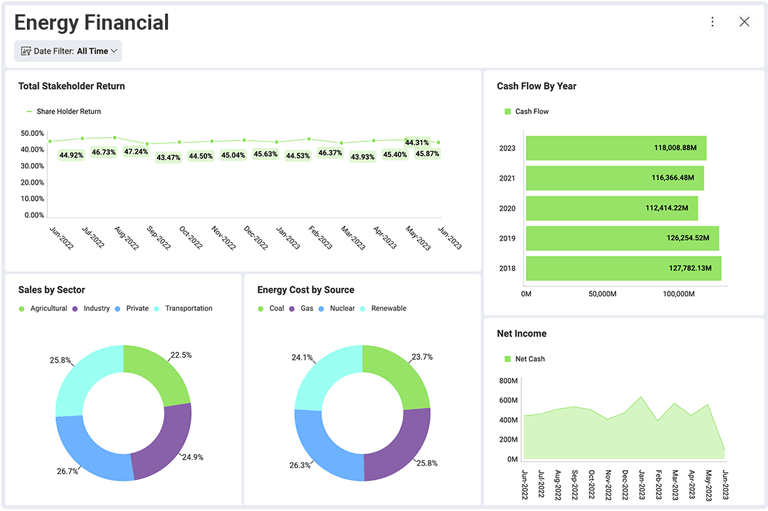
An energy financial dashboard is a great analytics tool for stakeholders, including finance managers, energy managers, or executives. It helps them gain visibility into financial data and KPIs related to energy consumption, costs, savings, and financial performance to make data-driven decisions, identify cost-saving opportunities, and optimize financial performance while managing energy expenses effectively.