
Scriptly Helps Pharmacies Identify Trends in Real Time with Reveal

The best embedded analytics solutions offer a lot more than just data visualizations. We gathered a list of 7 embedded analytics features you need to keep in mind when choosing your embedded analytics vendor.
Businesses continue to make analytics and BI their top investment priority. But in today’s data-driven and highly competitive business environment, choosing an embedded analytics solution for your business could be quite overwhelming. To help you out with this key decision, we’ve compiled an embedded analytics features checklist to guide your search for embedded BI software.
Embedded analytics directly integrates business intelligence (BI) capabilities into existing software applications’ user interface (UI), delivering real-time reporting, interactive data visualizations, and/or advanced analytics, such as machine learning. It focuses on bringing insights into context, so users can act at the moment of impact, never missing an opportunity to improve operations as well as decision-making.
Healthcare, finance, manufacturing, retail, and more industries are using embedded analytics capabilities to collect and analyze large amounts of business data for various purposes, such as to improve their product and services, add value for their customers, enhance user experience, generate additional revenue streams, prevent fraud and so much more. Embedded analytics brings numerous benefits to its customers, one of the main benefits of which is providing up-to-date insights in the simplest way so that anyone can understand it, even those that don’t have any knowledge or experience with data.
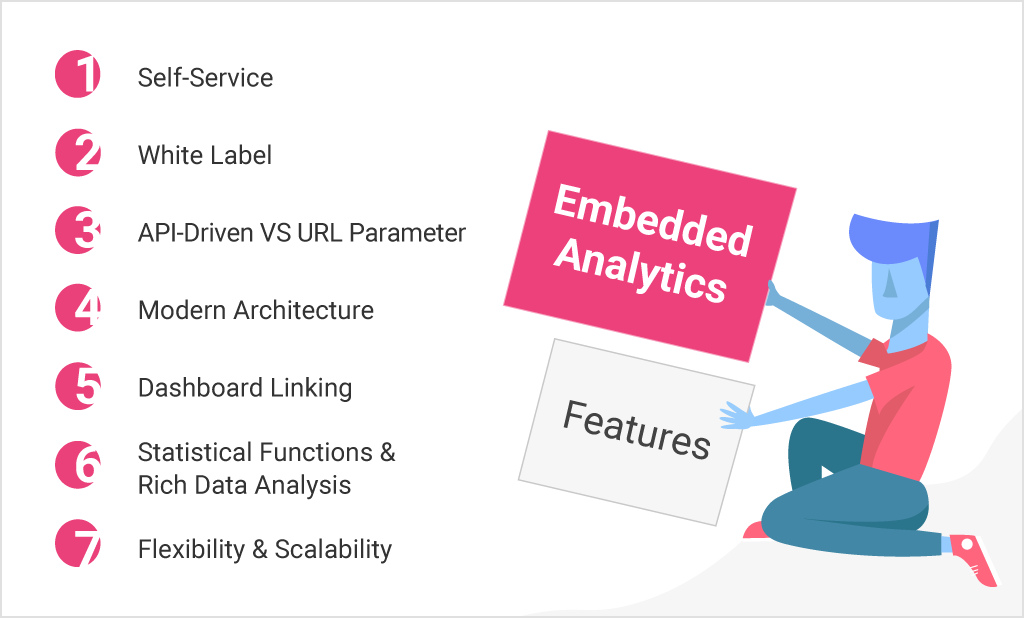
The best embedded analytics solutions offer a lot more than just data visualizations. We gathered a list of 7 embedded analytics features you must remember when choosing your embedded analytics vendor. So, without any further ado, here they are:
It is important not to forget that all of your users are different. Whether for telecommunications, banking, or insurance, they all have a unique use case for analytics. And what’s more, each user has a different level of sophistication when it comes to analytics.
With this in mind, self-service is one of the top embedded analytics features. Self-service BI refers to the processes and tools that empower end-users to analyze large amounts of data, build custom dashboards, and create reports independently without relying on your IT professionals or data analysts.
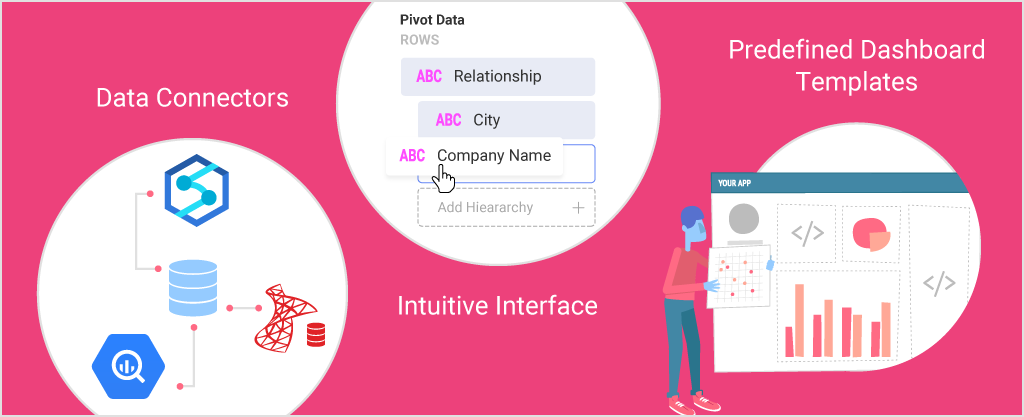
These are a few of the primary things you should be looking for in respect of self-service features:
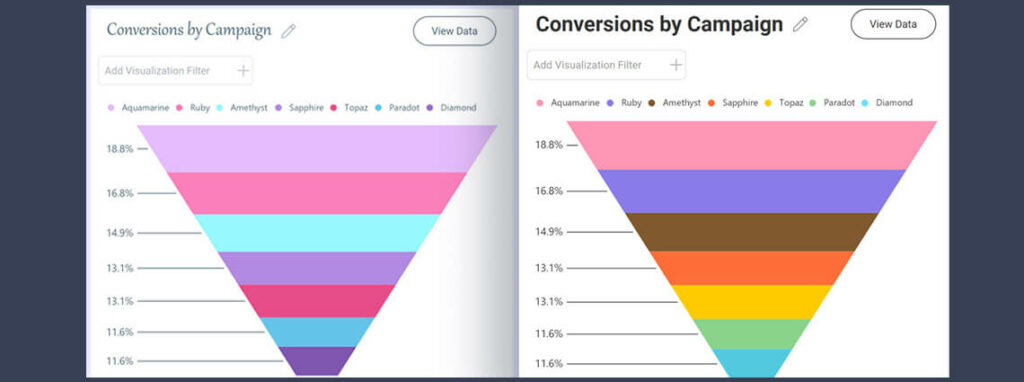
When the analytics users are being provided with don’t look or feel as if they belong in the applications, the user experience of your application drops dramatically. Every business owner and manager wants its business users and customers to be happy and satisfied and establish loyal relationships between both parties. This is what white labeling helps with.
White labeling is the ability to embed reports, dashboards, and visuals to match your unique application’s fonts, colors, and overall brand theme. It allows you to customize all UX elements (theming & styling, roundness vs squareness, dialogs, etc.) to match your brand perfectly. Thanks to that, users won’t get distracted or even notice the difference in the application but instead focus on the value of data.
In today’s fast-paced business environment, companies are now exchanging data and services more than ever. These connections and partnerships are fantastic and benefit both businesses and users. On one side, businesses are able to add more value to their offerings without the need to dedicate time and effort to develop functionalities. On the other side, users get to use more sophisticated products and services, which have everything they need.
So, whenever you decide to invest in an embedded analytics solution, look for a provider that will allow you to use a native SDK that is made for developers. With it, you aren’t forced to simply embed iFrames in your application, and you aren’t forced to configure dashboards with a parameterized URL. Contrary, you can use an API-driven approach to configuring dashboards by using real code with real objects and real properties. The API-driven development approach makes a developer’s life easier and the app development process simpler.
According to the results of a global survey of IT and business executives released by CA Technologies and conducted by Frost & Sullivan, adopting a modern application architecture is crucial to business success and a significant driver of profit growth.
Business executives agree that modern application architecture increases the scalability, connectivity, and security levels of any digital business while delivering a more valuable experience to customers, partners, suppliers, and employees. They also agree that it provides an easier path for software development while generating powerful insights and accelerating time to market.
The developer’s experience can make or break an embedded analytics implementation; therefore, your BI vendor needs to keep pace with modern technology and be able to simplify this process for you. Here are a few examples:
Dashboard linking allows you to connect visualizations in a dashboard or an entire dashboard directly to other dashboards or even URLs. With dashboard linking, you can pass parameters and filters between dashboards to simplify drilling down to additional insights. For example, if you want to provide more details on the information displayed in a visualization, you can use an entirely new dashboard for that purpose. This can be very useful in Company 360 dashboards, where you will be able to establish top-down analysis paths, where you go from a high-level overview of the reality of a business to more detailed views with the specifics.
Other vital embedded analytics features include statistical functions and rich data analysis. They help you gain deeper data insights, better understand and predict customer behavior, and answer specific questions about your market.
In terms of data analytics, statistical functions are the use of mathematics to perform technical analysis of data. For example, basic data visualization, such as treemap can give you high-level insights, but with statistics, you get to operate on the data in a much more data-driven and targeted way.
These are some of the key statistical functions:
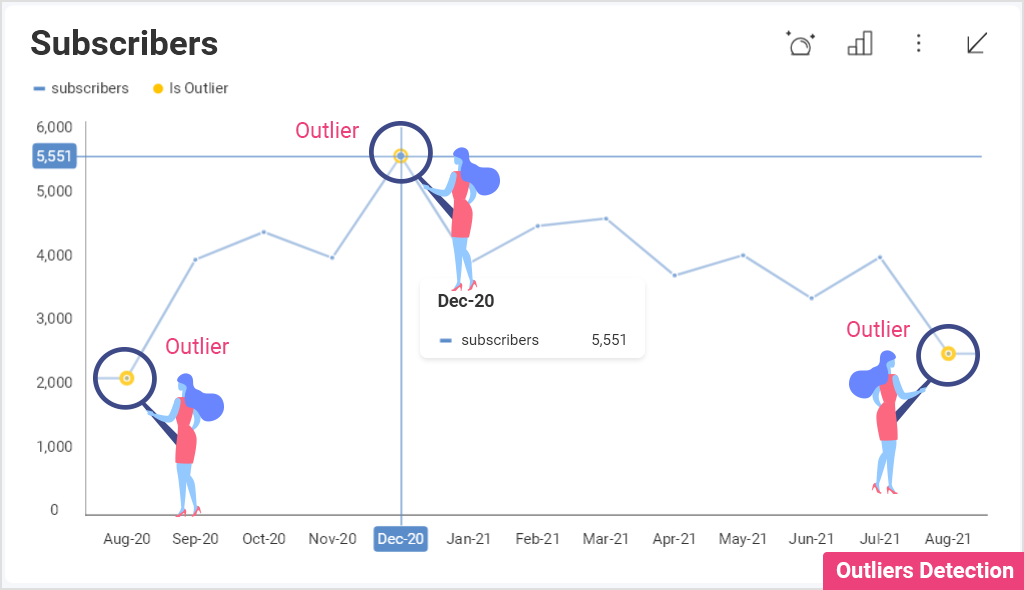
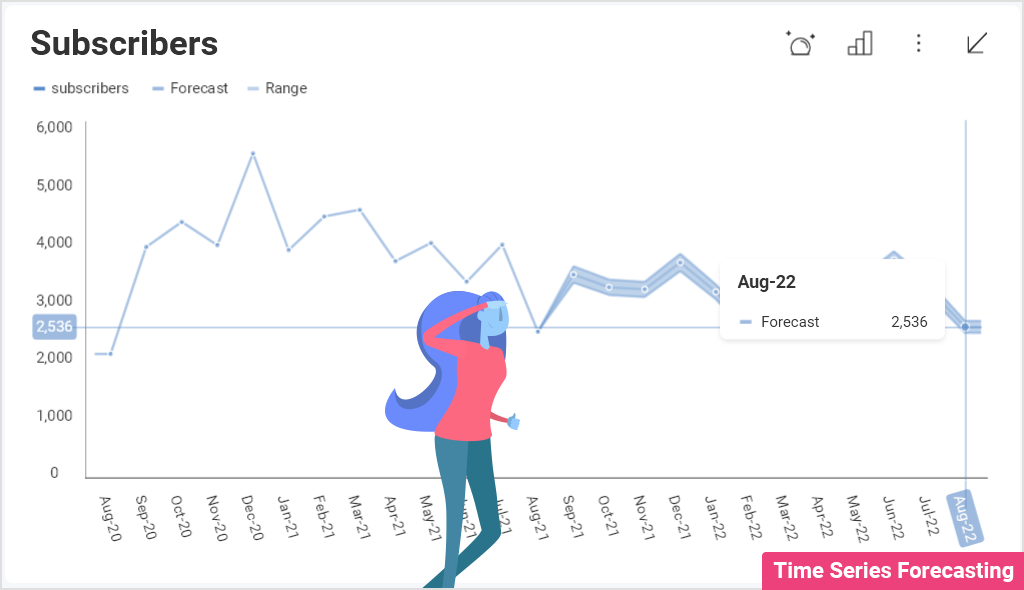
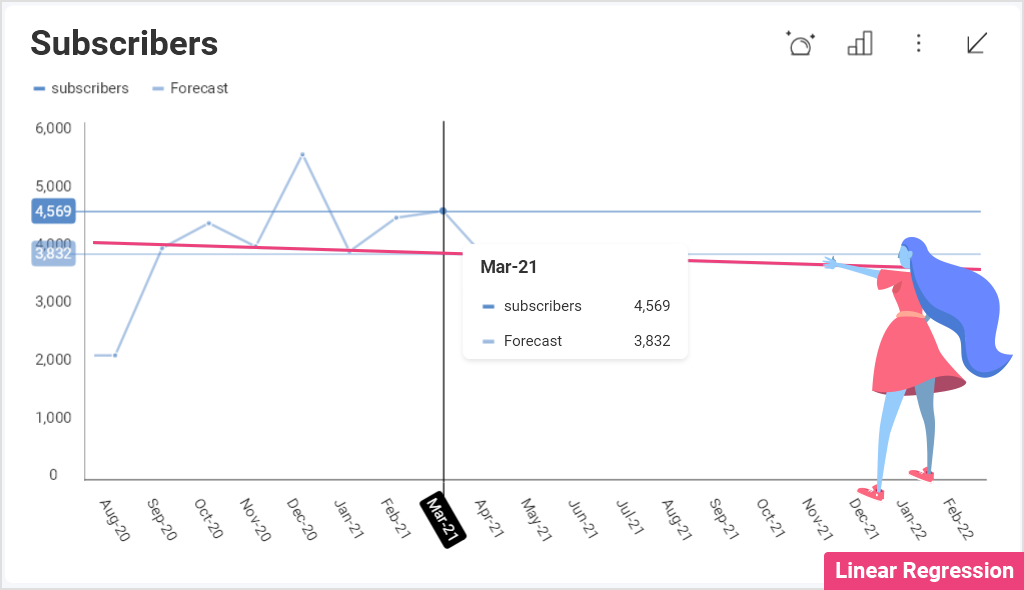
What other embedded analytics features you should be looking for are AI features and drill-down. AI can automatically analyze data and reveal patterns, trends, and insights that can be used by users to make better, data-driven decisions. The drill-down takes a user from a general overview to a more detailed analysis with a single click.
Flexibility is an embedded analytics feature that you shouldn’t overlook. It doesn’t add extra functionalities to your application, but it undoubtedly adds a ton of value to it. Allowing your users to be more flexible means allowing them to access and use your application on multiple platforms and devices, especially mobile devices.
Mobile is changing how we work and consume information, so it is highly important to choose an embedded analytics vendor with a native mobile version. This flexibility, or otherwise said mobile BI, allows users to access their work no matter where they are and stay productive even on the go.
Meanwhile, scalability allows your business to easily upscale or downscale your IT requirements as and when required. This means that a good embedded analytics vendor will allow you to increase your existing resources to accommodate increased business needs or changes.
Reveal brings the power of data to the hands of your employees, customers, partners, and suppliers. It allows you to easily integrate data analytics into your application with no added requirements. Reveal’s flexible architecture and rich APIs give you control of the feature in your app, making it a seamless part of the user experience.
Reveal provides interactive dashboards, drill-downs, collaboration, sharing, and true self-service with a drag-and-drop dashboard creator experience on any device that lets anyone build beautiful dashboards in their apps.
With the power of data, you, your employees, customers, partners, or suppliers will no longer need to waste time trying to analyze spreadsheets but instead have more time to focus on the insights gathered and make choices based on facts. You can act at the right moment and never miss an opportunity by having access to real-time data.
You can learn more about Reveal and how it works by downloading our SDK or by scheduling a quick demo.