Embedded Analytics SDK vs iframes: Which is the Better Integration Option?
While both purpose-built embedded analytics SDKs and iframes allow for the integration of data analytics capabilities in an application, they come with some key differences. In this blog we discuss these two options to determine their pros and cons so that you can decide which is best for you and your end users.
White-Label Software and Analytics: Enhancing Your Brand
Fully branded white label dashboards offer custom personalization so that your customers can present a holistic service that is all branded to one company.
This update is packed with customization, usability, and performance improvements to help you build seamless, high-impact analytics experiences faster.
Latest Update Features:
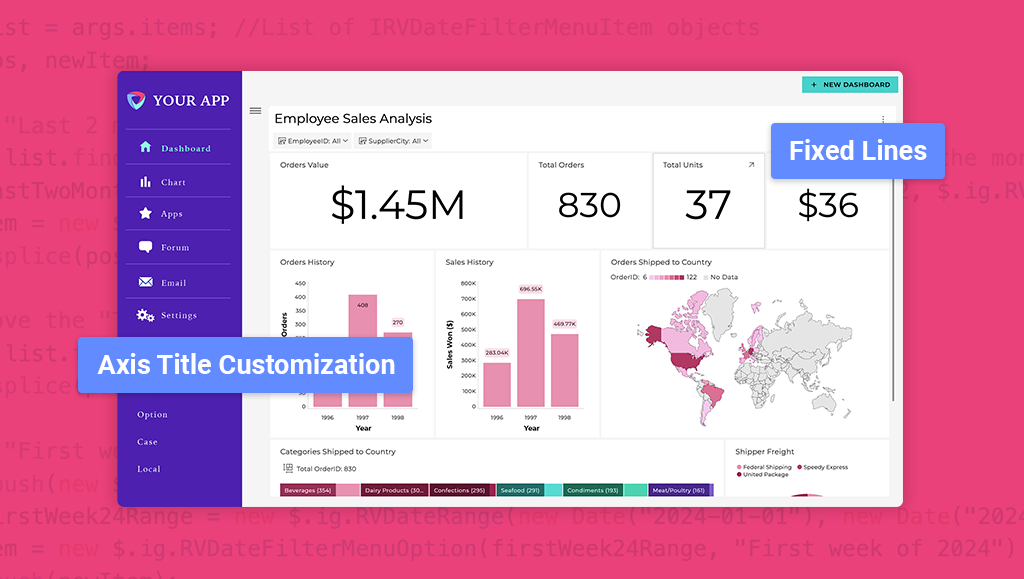
Axis Title Customization: Modify axis titles directly in the editor for clearer, more precise labeling.
Fixed Lines for Charts: Set static reference points to highlight key data trends.
Smarter Numeric Axis Labeling: Reduce label clutter and improve readability.
Flexible Chart Legend Positioning: Move and align legends for better dashboard design.
Grid Paging with Sorting: Instantly organize data with new column sorting capabilities.
Optimized Data Label Placement: Improved visibility for column and bar charts.
Date Filter API Update: More structured filtering for developers.
These game-changing features make it easier than ever to deliver intuitive, on-brand analytics inside your applications.
Feature Breakdown: What’s New & What It Means for You
Axis Title Customization: More Clarity, Less Confusion
Direct Customization: Click and edit axis titles right from the visualization editor.
Improved Readability: More descriptive labels mean faster data interpretation.
Fixed Lines: Set Key Benchmarks in Charts
Static Reference Points: Easily highlight important thresholds for better comparisons.
Customizable Appearance: Adjust line color and thickness for better visibility.
Numeric Axis Labeling: Clean, Precise, & Readable
Smart Label Spacing: Avoid overlapping and unnecessary labels.
Optimized Display: Get a cleaner look without losing critical context.
Chart Legends: Position & Align for a Better Layout
Flexible Positioning: Move legends to the top or bottom of visualizations.
Custom Alignment: Left, right, or center—control it in the Settings tab.
Grid Paging: Now with Sorting for Faster Data Organization
Interactive Sorting: Click column headers to instantly reorder data.
Improved Usability: Quickly find and analyze key information.
Optimized Data Label Placement: Clearer Insights at a Glance
Column Charts: Labels now sit above columns for quick identification.
Bar Charts: Labels appear to the right of bars for improved clarity.
Refined Visibility: Enhanced placement for easy interpretation across charts.
Date Filter API Update: More Power for Developers
Enhanced API Usability: The onDateFilterMenuOpening event now utilizes IRVDateFilterMenuItem objects for more structured handling.
Conclusion: Build Smarter, Faster, and More Intuitive Analytics
This update isn’t just about new features—it’s about giving you more control, better performance, and an even smoother analytics experience.
For a complete list of enhancements, new capabilities, and bug fixes, be sure to check out the full Release Notes.
Already using Reveal? Get the latest update now!
New to Reveal? Don’t let competitors outpace you. Build on-brand, scalable analytics today.
Fill out the form to get a personalized demo of Reveal.
Thank you for reaching out!
A Reveal representative will be in touch with you shortly!
Your Privacy Matters: We use our own and third-party cookies to improve your experience on our website. By continuing to use the website, we understand that you accept their use. Cookie Policy.