Scriptly Helps Pharmacies Identify Trends in Real Time with Reveal
Reveal business intelligence blog gives you the latest embedded analytics trends, how-tos, best practices, and product news.

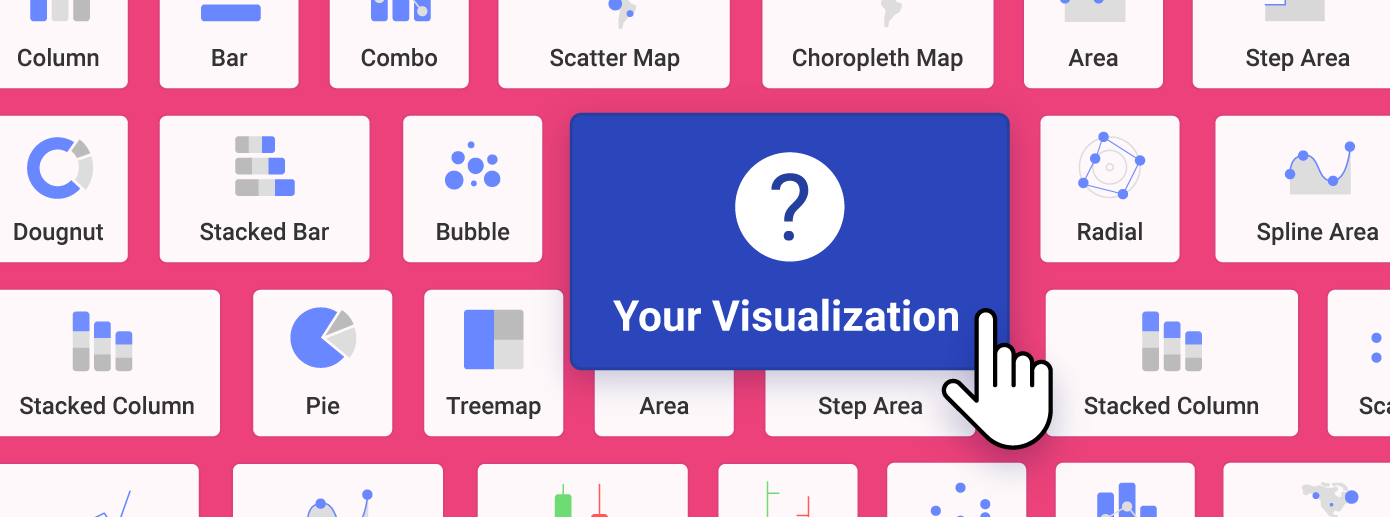
With Reveal’s DIY custom visualizations feature, you can tailor the experience for your users by controlling the chart types available within your dashboards. This customization ensures that your data is presented in a way that’s most relevant to your specific needs.
Continue reading...
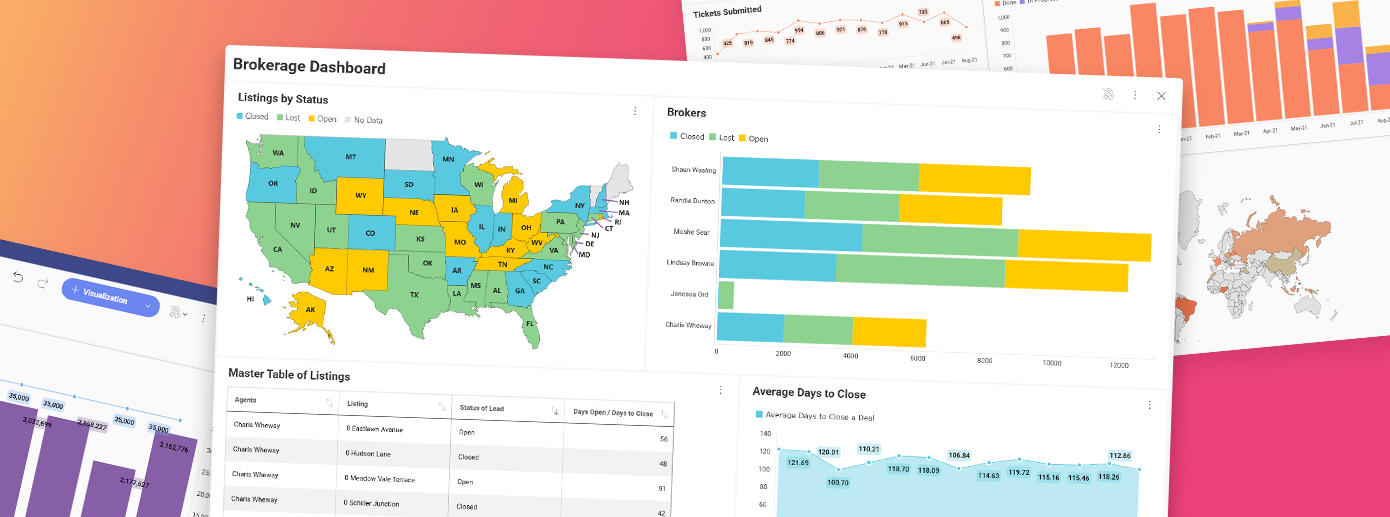
Embedded analytics tools like Reveal help users create beautiful, high-effective dashboards with the right purpose, chart type, essential data, and effective interactions in half the time.
Continue reading...
Chartio is a cloud-based business intelligence and analytics solution that provides business teams with the tools and functionalities for data exploration and data visualization. It’s one of the most popular visualization tools on the market that helps decision-makers make refined graphs, reports, and dashboards, and take the best case decisions faster. Or it used to be. You may […]
Continue reading...
Data-driven insights can help you identify business opportunities, detect customer journey leaks, and proactively identify weaknesses in your product before they grow into serious problems.
Continue reading...In this blog, I’m going to show you how to create a population pyramid chart that provides an attractive at-a-glance view of the demographics of a country, typically broken down by male/female, though it can be used for other demographics as well. Here’s what the final chart will look like: Before diving into how you can create a population pyramid chart, let’s first review some of the basic chart types. What […]
Continue reading...
In a recent podcast interview with SD Times, our Senior VP of Developer Tools, Jason Beres, talks about some of the key steps companies should consider as they begin to implement data analytics. One of his main points is the need for guidelines around compliance, privacy, and governance as data is captured, analyzed, and shared. He notes that […]
Continue reading...
If you have been using Reveal, you know how easy it is to create dashboards with any number of data sources. Reveal is built by user experience experts and made for business users. It has a familiar drag and drop experience that makes it simple to use. However, the visualization editor is packed with features that […]
Continue reading...