
Scriptly Helps Pharmacies Identify Trends in Real Time with Reveal
Tableau Embedded is often used to extend internal dashboards into external apps, but its architecture poses challenges for customer-facing products. iFrames limit UI control, pricing scales with usage, and customization is constrained. As expectations shift, many CTOs and SaaS leaders are prioritizing embed-first platforms with developer control, white label flexibility, and built-in AI for product environments.
Continue reading...
Find out what are the pros and cons of the Sisense embedded analytics platform and how it matches Reveal’s self-service embedded analytics solution.
Continue reading...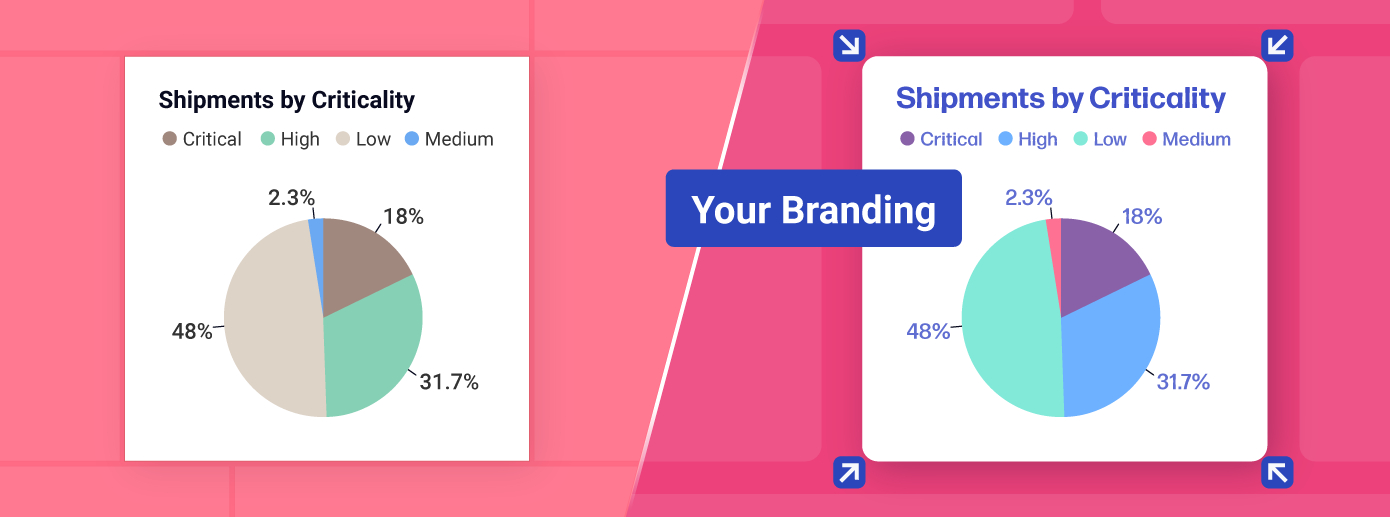
Fully branded white label dashboards offer custom personalization so that your customers can present a holistic service that is all branded to one company.
Continue reading...
In the embedded analytics space, however, you’ll be hard-pressed to find clear, transparent, and publicly available pricing. Most embedded analytics vendors keep their pricing a secret and charge you unpredictable costs like usage and users.
Continue reading...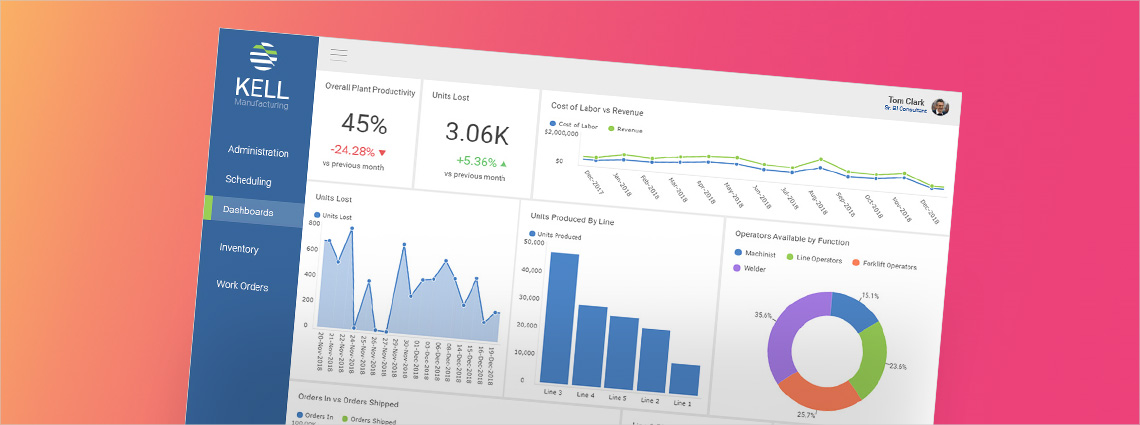
It’s important that analytics and visualizations are embedded within the ERP software itselfitself, so users don’t have to export the data to a separate application. And if the analytics are easy for business users to use with self-service capabilities, then more people throughout a company can do deeper dives into a range of pertinent business data.
Continue reading...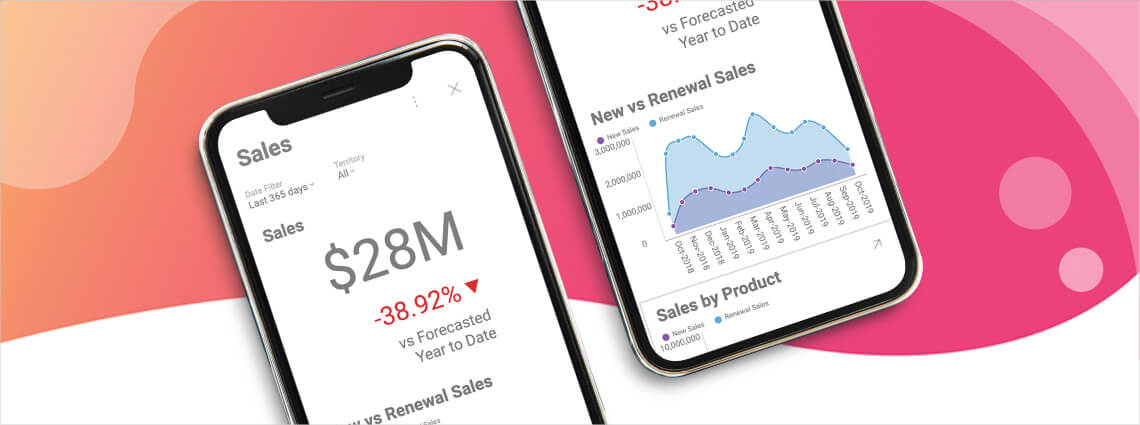
Having company insights at your fingertips is the most valuable advantage of mobile BI. You are not limited to one computer in one location, but instead, you can access important data information on your mobile device at any time and from any location.
Continue reading...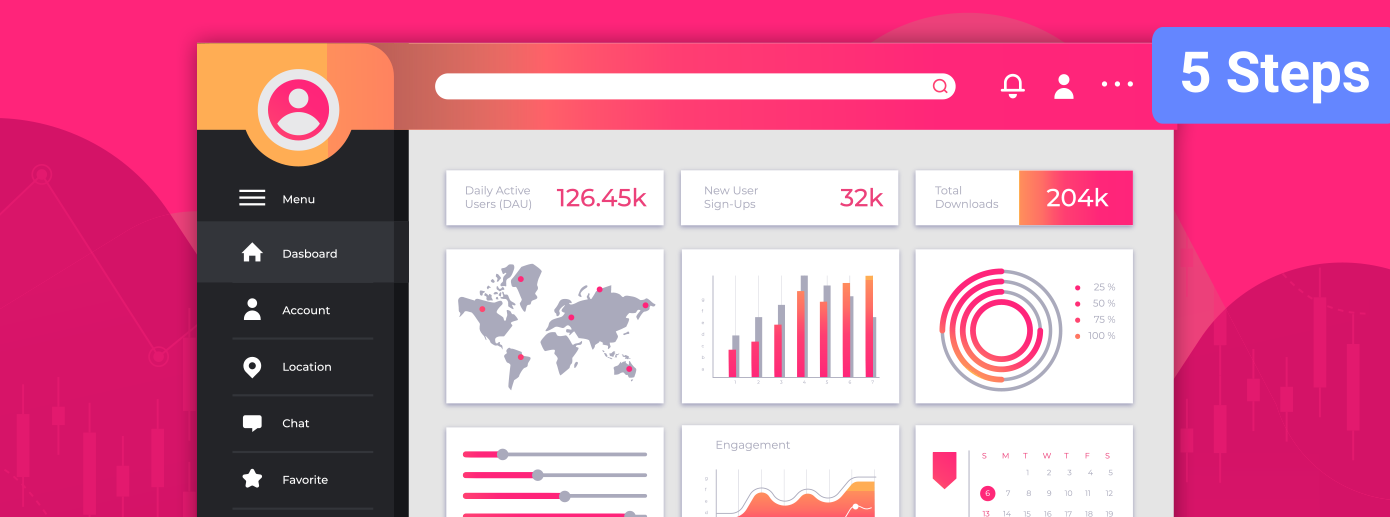
Legacy apps limit product velocity and insight delivery. Embedded analytics in app modernization helps SaaS teams replace slow workflows with in-product decisions. This guide breaks down five practical steps to modernize architecture, improve user experience, and monetize analytics as a product feature. Reveal gives your team the SDKs, security, and white label control to embed fast, scale cleanly, and reduce backlog.
Continue reading...
Data-driven insights can help you identify business opportunities, detect customer journey leaks, and proactively identify weaknesses in your product before they grow into serious problems.
Continue reading...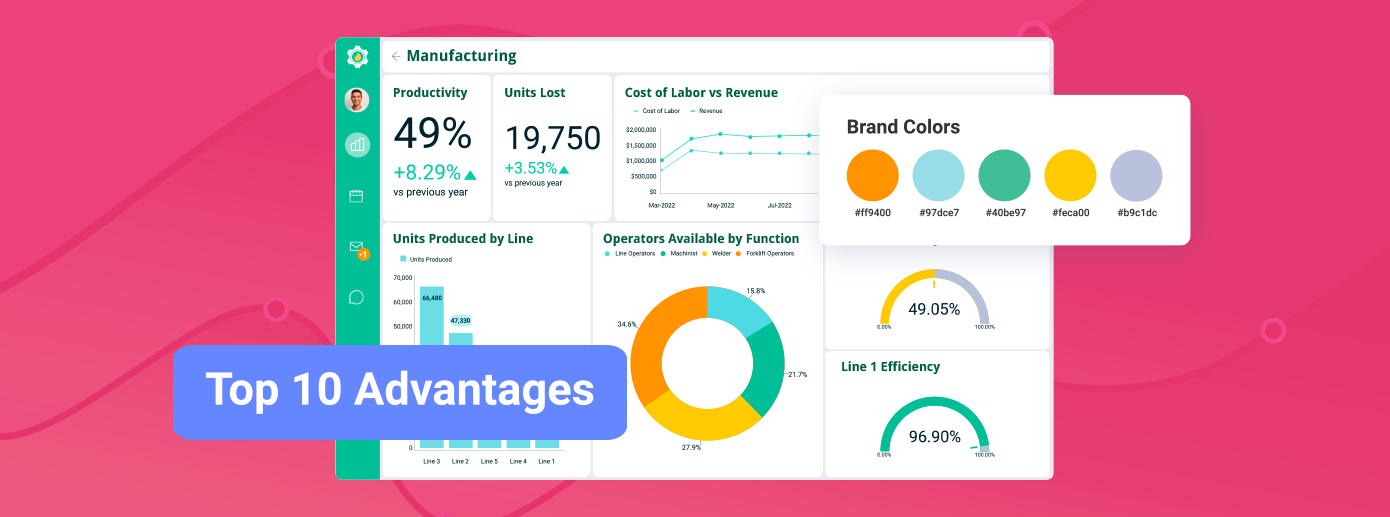
The real value of embedded analytics is how it strengthens products and business outcomes. It shortens development cycles, cuts costs, and keeps analytics inside the workflow where users need it. The biggest payoffs are higher adoption, predictable ROI, and new revenue through monetization. With SDK-first integration, white-label control, and AI-powered insights, embedded analytics delivers scale, flexibility, and a lasting competitive advantage.
Continue reading...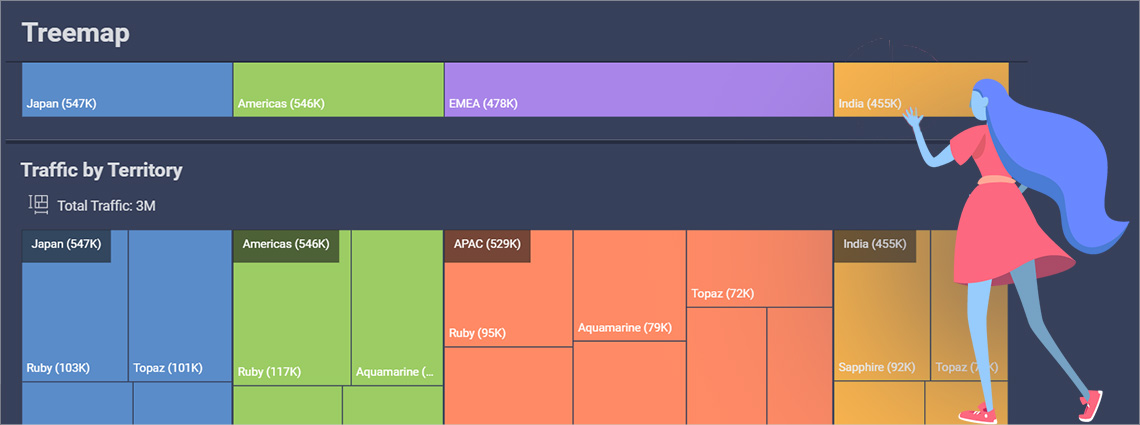
A Treemap Chart is designed for drill-down scenarios. It shows the relative weight of data points at more than one level allowing users to continuously drill down deeper into the data set that is represented by smaller rectangles for more efficient analysis.
Continue reading...Back to Top