Scriptly Helps Pharmacies Identify Trends in Real Time with Reveal

Lanxing Software (Shanghai) Co., Ltd, is a leading provider of end-to-end digital decision-making solutions for the supply chain in China. The company helps enterprises reduce operating costs, improve gross profit margins, empower digital teams, establish digital decision-making scenarios for supply chain planning and planning, and enable digital transformation of enterprise supply chains.
Lanxing’s SaaS supply chain solution, SCATLAS, enables customers to model and optimize their end-to-end supply chain effectively and quickly. From sourcing, manufacturing and inventory to logistics and transportation, Lanxing customers can improve margins to enhance service, increase freshness, and reduce risk exposure in the supply chain.
By leveraging advanced technologies such as data modeling and transformation, AI/ML, optimization, and simulation, Lanxing provides a comprehensive platform that enhances every stage of the supply chain, including procurement, manufacturing, inventory management, logistics, and customer fulfillment. This results in measurable value and digital transformation within the supply chain.
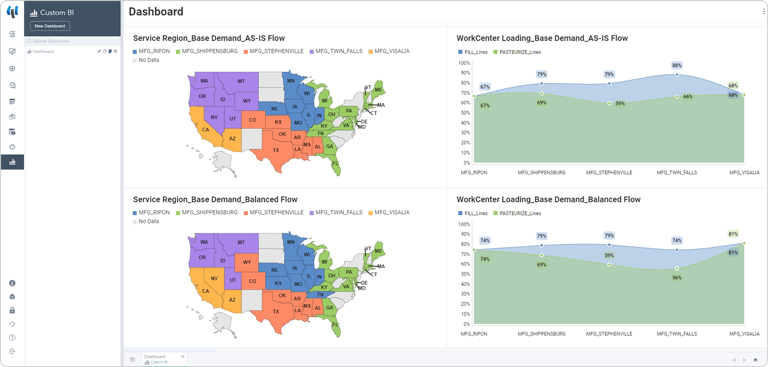
 Reveal dashboard comparing service region and work center load between as-is and optimized flow.
To better serve their customers, Zhen Wang, Product Director at Lanxing Software sought a visual self-service BI tool that could seamlessly integrate into their existing solution, as the built-in BI charts in SCATLAS were not always able to meet clients’ personalized data analysis needs. For example, Lanxing users often require customized categorization of products, customers, and transportation routes. Lack of this capability could be a deal breaker for their clients.
After evaluating multiple embedded BI tools, including PowerBI, they found that the best solution was Reveal, which provided a powerful self-service BI tool that seamlessly integrated into the existing SCATLAS platform. Other all-in-one solutions were heavy-loaded services that could slow down Lanxing’s own application, hurt user experience, and had overlapping functions with their own solution.
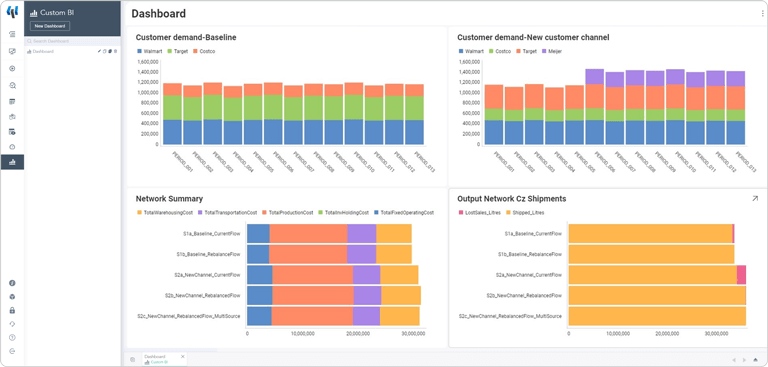
 Reveal dashboard comparing supply chain network designs after adding new customers.
Reveal enables users to calculate, analyze, and create personalized reports and dashboards from the output of SCATLAS. With chart types for every situation, including bubble charts, tree maps, funnel charts, KPI indicators, and the ability to add multiple data sources for calculation and combination, Reveal provides the tools needed to create and save customized dashboards. This integration is essential for delivering fast, insightful, and actionable data to Lanxing users, enhancing their decision-making capabilities and overall efficiency.
In SCATLAS, Lanxing’s customers use the BI capabilities powered by Reveal to create personalized dashboards to monitor the metrics they care about. Graphical representations make comparing metrics intuitive and straightforward, enabling users to effortlessly make data-driven supply chain decisions.
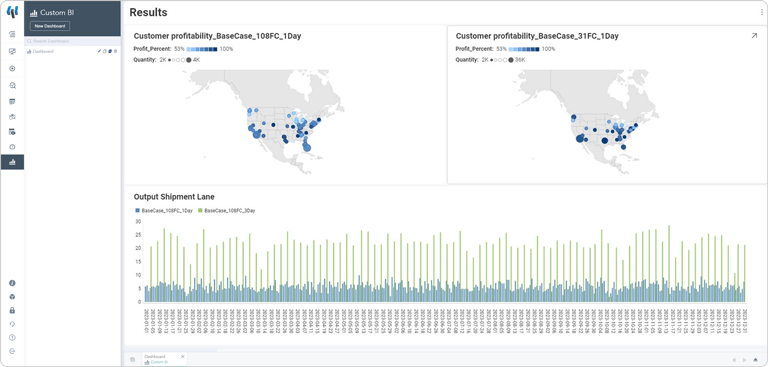
 Reveal dashboard comparing shipments between different network rationalization and service level changes.
“In the supply chain industry, users need to quickly translate results and data into actionable decisions and Reveal does this with ease.”
Zhen Wang, Product Director, Lanxing Software
“We are dedicated to empowering corporations with enhanced data-driven decision-making in their supply chain operations. The built-in BI charts in SCATLAS did not always meet our clients’ personalized data analysis needs and we needed an outside solution. Reveal, with its flexible reporting capabilities and comprehensive SDK for full integration, was the ideal choice,” said Zhen Wang, Product Director, Lanxing Software. “Integrating Reveal into the system fills the gap in SCATLAS for self-service BI analytics, allowing users to customize data analysis logic and dashboards with indicators according to their own business needs. Reveal also saved Lanxing Software at least six months of development time that would be needed to create a full-featured BI tool.”
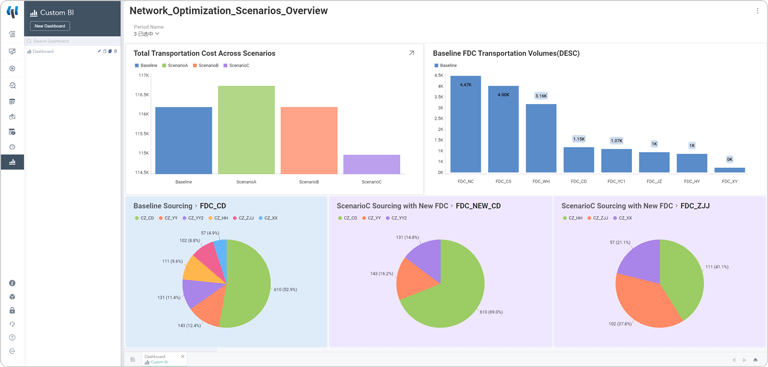
 Reveal dashboard comparing transportation scenarios after adding new front distribution center.
“Reveal also offers continuous user support and regular software updates. We are very pleased with the Reveal solution and their high level of customer service.”
Zhen Wang, Product Director, Lanxing Software
Back to Top